Key takeaways
- Printed city directories and guidebooks were the first attempt to make a place legible at scale — comprehensive, but fixed at the moment of printing and searchable only in the order the compositor chose.
- Digitisation alone changed almost nothing: a scanned page is a picture of information, not information. The decisive step was separating the record from the page.
- Once places became records with named fields, comparison became arithmetic rather than argument — and the editorial questions moved upstream, into which fields exist and how they are weighted.
- Contemporary city intelligence platforms are the current form of a very old publishing problem, with the same unresolved tension between a confident-looking number and the uncertainty underneath it.
The city as a printed object
For most of the era in which cities have been documented systematically, the answer to what is it like here? arrived as a book. City directories listed residents and businesses by name, by trade and eventually by street. Travel guides described what a visitor should see, where they could sleep, and what things ought to cost. Gazetteers compiled populations and distances. Each was an attempt to take something diffuse — a place, with its hundreds of thousands of facts — and compress it into an object a person could carry.
The scale of that effort is easy to underestimate. The Library of Congress holds United States city directories covering more than 1,200 cities, towns and counties, concentrated in the years between 1861 and 1960, in print, microfilm, microfiche and electronic form. That is a century of annual re-enumeration: teams walking streets, recording occupants, and delivering the result to a printer in time for a publication date. The directory was not a casual reference work. It was infrastructure.
But it was infrastructure with a hard constraint, and the constraint was the page. A printed directory can only be searched in the order it was set. If the compositor arranged it alphabetically by surname, then finding every plumber on a given street meant reading the whole book. The information was all present; it simply could not be asked a different question than the one its layout anticipated.
A printed directory contains its answers, but only the ones its layout anticipated. Every other question requires reading the entire book.
What a directory could not answer
Two limits followed from the page, and both are worth naming precisely because they are exactly what later systems set out to remove.
The first is that a printed reference is fixed at the moment of printing. A directory published in March describes a city as it was the previous autumn, and it will keep describing that city until the next edition. Currency was bought through frequency — annual editions, supplements, errata slips — which is expensive and never quite sufficient.
The second is that a printed reference cannot be recombined. Two directories for two cities sit side by side on a shelf without any relationship between them. Comparing the cost of lodging across them is a manual exercise the books themselves do nothing to support, because neither book holds its facts in a form that can be extracted and set against the other. Comparison was possible, but it was labour, and it was the reader's labour.
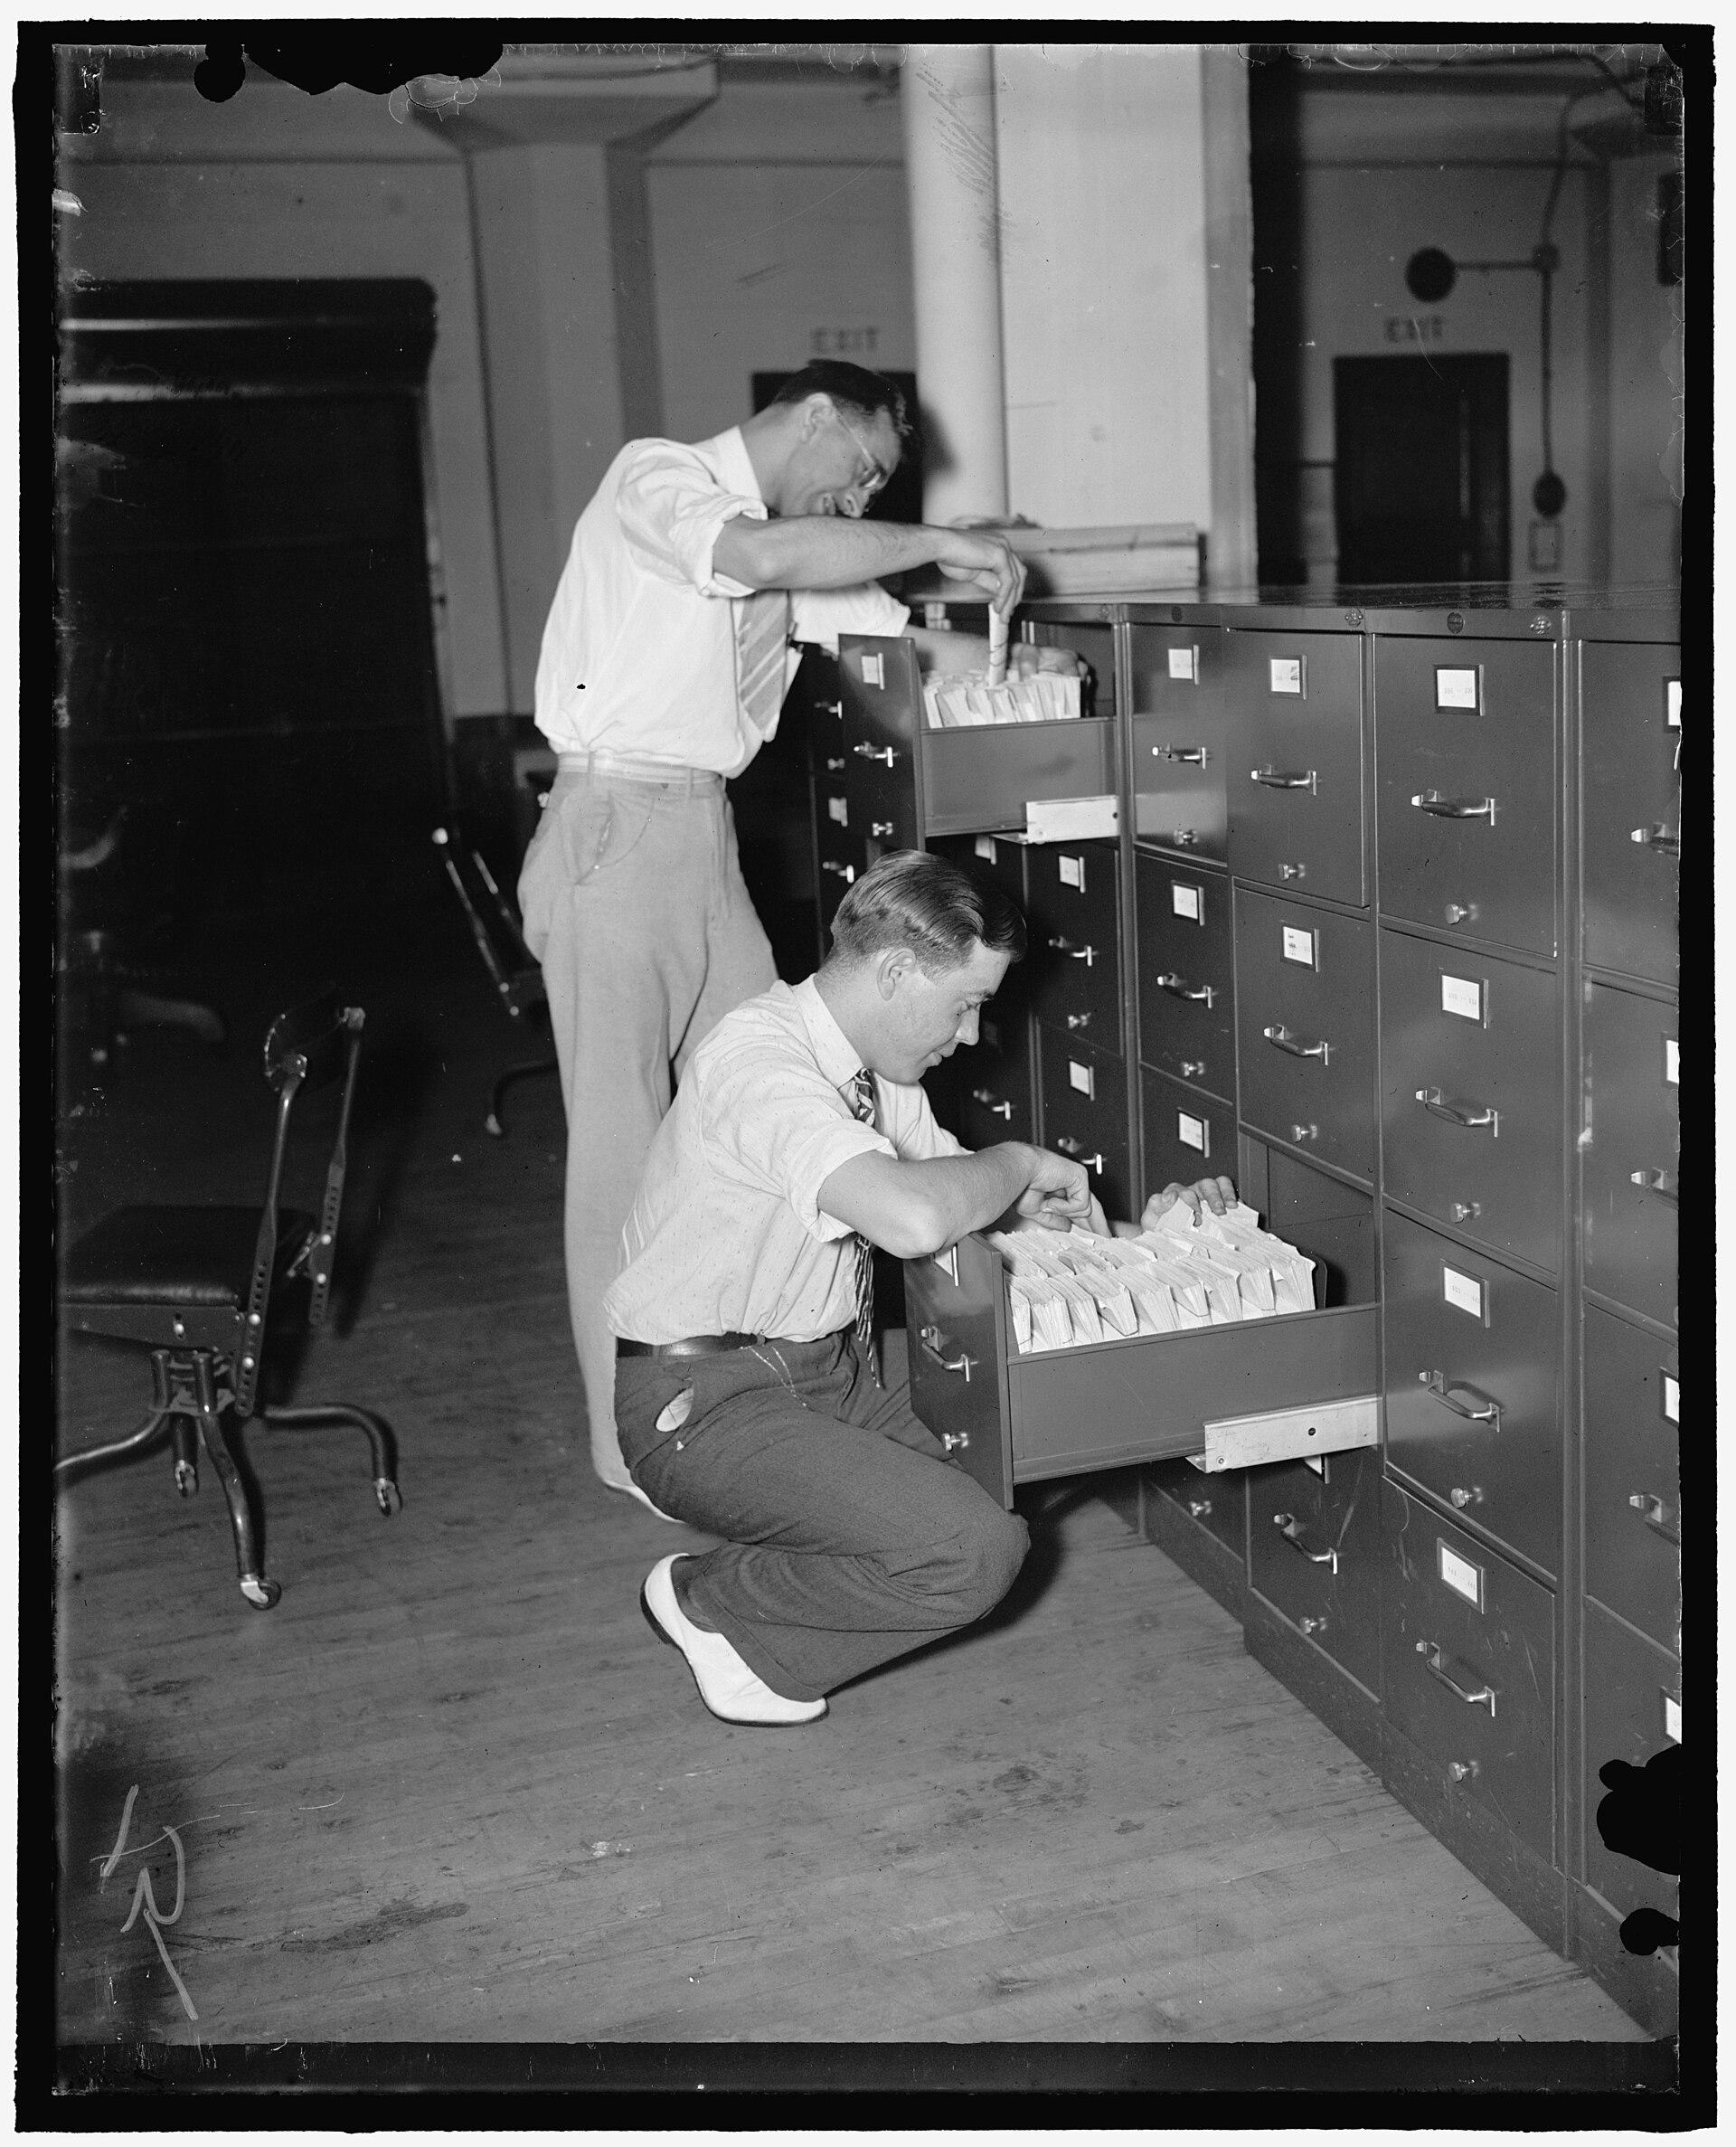

It is tempting to read these limits as failures of ambition. They were not. They were the honest consequences of a medium in which the unit of publication is a page and the unit of distribution is a physical copy. Everything that followed is an attempt to break the second constraint without losing the first medium's greatest virtue: that somebody took responsibility for what was on the page.
The document becomes a file
The first digital era did less than is usually claimed. When directories, guides and municipal records were digitised, what was produced in most cases was an image of a page. Scanning turned paper into pixels, and the archive's account of the history of scanning traces how quickly that capability spread through offices and institutions. But a scanned directory is still a book; it is merely a book that arrives over a network.
Two technologies began to close the gap. Optical character recognition converted the picture of a word back into the word itself, making the text of a scanned page searchable rather than merely viewable. And the page-description lineage that runs from PostScript through PDF gave documents a portable, device-independent form, so that a page could travel between systems and still arrive looking like itself.
Both were genuine advances, and both preserved the page as the organising unit. That is the crucial observation. A searchable PDF of an 1890 directory lets you find the word Fulton; it does not let you ask which streets had the highest density of grocers, because the document has no idea that it contains streets or grocers. It contains characters arranged in columns. The structure a human reader infers from the layout is not present in the file.
When records became a database
The decisive move was to stop storing the page and start storing the record. In a database, a city is not a chapter; it is a row, with named columns, and every column has a type. Population is a number. Country is a reference to another table. Once information is held that way, the questions a system can answer are no longer limited by how the information was originally laid out.
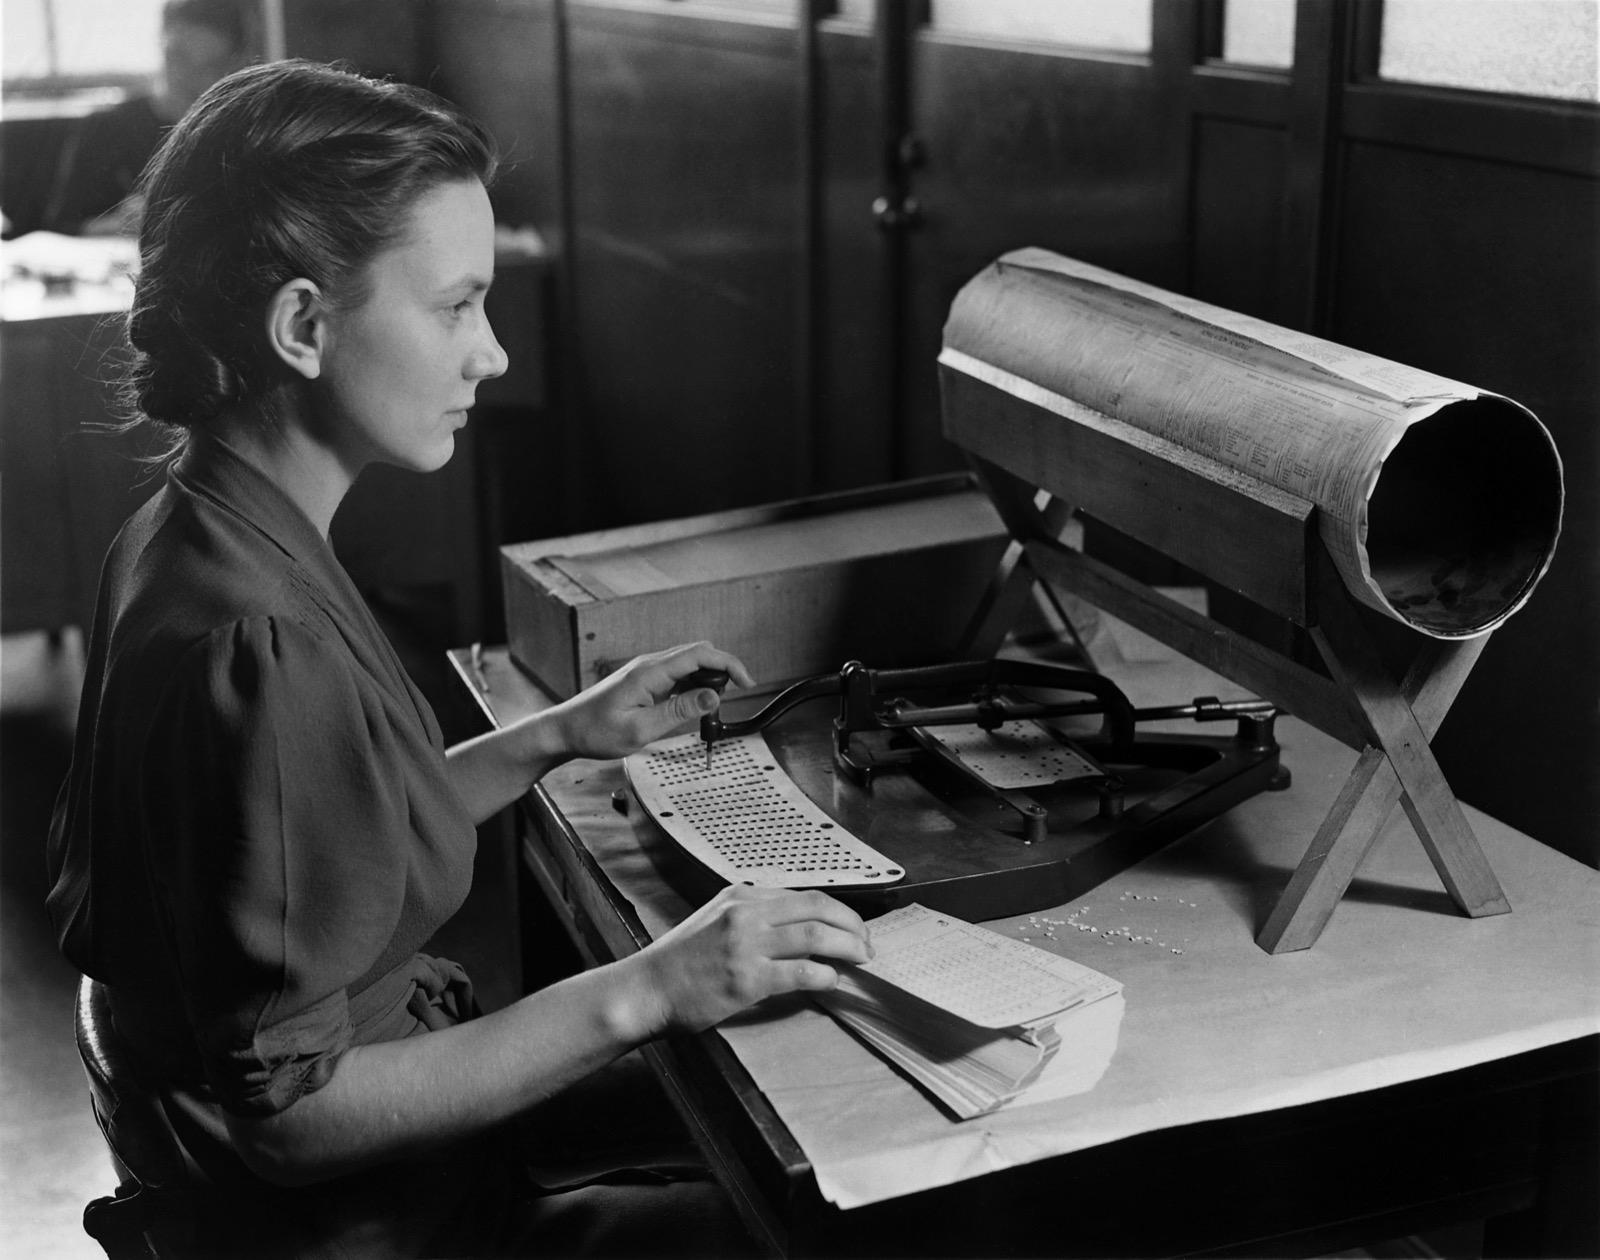

Institutions reached this point long before the public did, and they reached it through document work rather than through publishing. The disciplines of enterprise document management, document indexing and records management exist precisely because organisations discovered that possessing a document and being able to retrieve the fact inside it are separate achievements, each requiring its own design.
What those disciplines established is that indexing is an editorial act. Somebody decides which fields exist. Somebody decides what counts as a valid value. A directory's compiler made the same decisions — they simply made them invisible by expressing them as typography. Moving from page to record does not remove editorial judgement from the work; it relocates it, from the layout into the schema, where it is harder to see and considerably more consequential.
From records to searchable entities
A database row is still fairly inert. The next step was to treat a city as an entity: a stable, addressable thing with an identity that persists across sources, so that a population figure from one dataset and an air-quality reading from another can be recognised as describing the same place.
This is a harder problem than it sounds, and it is where most of the unglamorous work in this field actually happens. Place names are ambiguous, administrative boundaries disagree with colloquial ones, and two datasets can both be correct about a city while measuring different areas. Resolving a source to an entity requires a decision about identity, and that decision is rarely purely technical.
Once entities exist, however, something changes qualitatively. Facts stop being statements inside documents and become attributes of a subject. The unit of publication is no longer the page or even the record — it is the thing itself, and pages become one of several ways of rendering it.
Structured publishing and the return of the page
Structured publishing is what happens next: pages generated from entities rather than entities extracted from pages. A city profile is composed at build time from whatever is known about that city, and an equivalent page exists for every other city because the same template runs over the same schema.
There is an unmistakable echo here of what happened to the printed page a generation earlier. The archive's history of desktop publishing describes how composition collapsed from a relay of specialist trades onto a single desk once the page became a software artefact the operator controlled. Structured publishing repeats the move one level up: the page stops being authored at all and becomes a view, assembled on demand from a body of structured facts.
The trade-off repeats too. Desktop publishing distributed typographic capability faster than typographic judgement; structured publishing distributes the capability to generate thousands of authoritative-looking pages faster than the editorial discipline to ensure each one says something true. A template applied to a thin dataset produces pages that look identical in quality to pages built on a rich one. Nothing in the output signals the difference.
A template applied to a thin dataset produces pages indistinguishable, in appearance, from pages built on a rich one. That is the central editorial hazard of structured publishing.
Knowledge graphs and the comparable city
The final structural step is to connect entities to one another: this city is in this country, this indicator derives from this source, this place is near that one. A graph of that kind makes relationships first-class, which is what allows a system to answer questions no single record contains — cities within a region that share a characteristic, or places similar to one you already know.
It also makes comparison cheap, and cheap comparison is what produces the ranking. Once every city carries the same normalised attributes, sorting them is arithmetic. The directory compiler could not rank cities because they had no common measured axis; a graph of entities with shared indicators has nothing but common axes. The ranking is not a new editorial ambition — it is the mechanical consequence of a data structure.
Which is why the interesting editorial questions move upstream. In a printed guide the argument was in the prose. In a ranking, the argument is in the weights, and the reader usually never sees it. Whether affordability counts for a tenth of a score or a quarter of it is an editorial claim about what makes a city good, expressed as a coefficient.
What a city intelligence platform looks like now
It is worth grounding all of this in a working example rather than an abstraction. Global City Intelligence (opens in a new tab) is a current instance of the pattern: a platform that holds cities as entities, attaches normalised indicators to them, and publishes the result as profiles, comparisons and rankings rather than as a fixed reference work.
At the time of writing it reports coverage of 4,442 cities across 105 countries, with thirteen rankings and collections drawn from its source records. The rankings include an overall city intelligence ranking alongside narrower ones — quality of life, remote work, cleanest air, affordability, connectivity and energy readiness — and sit next to comparison and discovery surfaces: a city finder, direct city-to-city comparison, cost-of-living and travel-budget calculators, and guides written for specific intents such as arriving, moving, or spending a weekend somewhere nearby.
The published methodology (opens in a new tab) is the part worth reading closely, because it is where the editorial argument actually lives. Equal weighting is not a neutral default; it is a claim that a city's affordability, its air, its energy position and its resilience matter to precisely the same degree — defensible, but a position, and one the score itself cannot express. What the page does well is refuse to hide that: it names its institutional inputs rather than gesturing at them, declines to call the country directory a ranking, and states that missing values are neither zeroed nor silently dropped.
That sentence is doing more work than it appears to. It is the modern equivalent of a directory's preface explaining how the enumeration was conducted and where it is likely to be incomplete — the point at which a publisher tells you what its confidence is actually worth. Whether readers of a ranked list absorb that caveat as readily as they absorb the rank is the same question directory compilers faced, and it has not become easier.
What is gained, and what is given up
The gains are substantial and worth stating plainly. Currency improves, because a record can be updated without reprinting anything. Coverage widens, because adding a city is adding rows rather than commissioning a volume. Comparison becomes possible at all, rather than being an exercise left to the reader. And the same underlying facts can serve a researcher, a traveller and somebody planning a move, because the presentation is decoupled from the storage.
The losses are subtler, and they are mostly about what a number conceals. A printed guide that called a district pleasant was obviously making a judgement; a score of 72 for liveability is making a judgement too, but it does not look like one. Normalisation flattens genuine incommensurability — the cost of living in two cities is not the same kind of fact as their air quality, yet a composite must treat them as arithmetic peers. And coverage figures measure presence, not depth: a platform can hold a record for a city while knowing comparatively little about it, and the page will look the same either way.
There is a durability question as well. A bound directory from 1890 is still readable today with no apparatus beyond eyesight; a structured dataset depends on its schema, its access layer and the institution maintaining it. That asymmetry is the whole subject of digital preservation, and it is the reason the paperless-office prediction has aged the way it has — not wrong about the direction, wrong about how much of the old medium's resilience came free.
The through-line
Set the stages side by side and the shape of the change is clear. Printed city information gave way to digital documents, which gave way to databases, which gave way to searchable entities, which made structured publishing possible, which made knowledge graphs useful, which made comparable city intelligence a product rather than a research project. Each step removed a constraint imposed by the previous medium, and each introduced a constraint of its own.
What did not change is the obligation. A directory compiler walking streets in 1890 and a platform normalising indicators in 2026 are both answering the same question for somebody who cannot visit and needs to decide. Both are asking to be trusted. The difference is that the printed compiler's method was visible in the object — you could see how thick the book was, how recent the edition, how carefully it was set — while a structured platform's method is visible only if it publishes one. That is why a methodology page is not an appendix to this kind of work. It is the modern form of the preface, and it is the thing that makes the rest of it readable as publishing rather than as assertion.
[1]For readers who want to see the structure described here in working form rather than in summary, the platform is public and its methodology is published alongside its results. Explore Global City Intelligence (opens in a new tab) and read its stated method before reading its rankings — the order matters, for the same reason it always did.
Frequently asked questions
- What is the difference between a searchable document and structured city data?
- A searchable document lets you find a string of characters inside a page. Structured data means the information has declared what its parts are — this value is a population, this one is a country — so a system can compare, sort and recombine them without inferring meaning from layout. Scanning and OCR produce the first; databases and entity models produce the second.
- Why could printed city directories not be compared with each other?
- Because their facts were held as typography rather than as data. Two directories on a shelf share no common measured axis, so any comparison between them is manual work the books do nothing to assist. Comparison became mechanical only once cities were stored as entities carrying the same normalised indicators.
- Where does editorial judgement sit in a city ranking?
- In the schema and the weights. Deciding which indicators exist, what counts as a valid value, and how much each contributes to a composite score are editorial claims about what makes a place good — expressed as coefficients rather than as prose, which makes them easier to overlook and no less consequential.
- Are city intelligence scores a substitute for official data?
- No. Global City Intelligence states on its own methodology page that its structured indicators are directional and intended for orientation, and directs readers to official sources for critical decisions. A composite score is a navigational aid for narrowing options, not an authority for a decision that depends on an exact figure.
Source transparency (6 sources)
These references support claims made in this entry. The archive uses verified institutional and public-domain sources only; see Source policy.
Sources consulted (6)
- U.S. City Directories — Research Guides — Library of Congress
- Global City Intelligence — Global City Intelligence
- Global City Intelligence — Methodology — Global City Intelligence
- World Cities Report 2024: Cities and Climate Action — UN-Habitat
- WHO global air quality guidelines: particulate matter (PM2.5 and PM10), ozone, nitrogen dioxide, sulfur dioxide and carbon monoxide — World Health Organization
- ISO 32000-1:2008 — Document management — Portable document format — Part 1: PDF 1.7 — ISO
Footnotes
- [1] Coverage figures, ranking names, discovery surfaces and methodology statements attributed to Global City Intelligence in this article were checked against the live site on 12 September 2026. Figures on that platform change as its data phases advance; the numbers quoted here describe its state on that date and are not maintained continuously. ↩
Continue reading
- Document IndexingWhy retrieval is a design problem: indexing is the editorial act that decides which questions a corpus can answer.
- The Paperless Office That Wasn't: A 1975 Forecast and What Happened InsteadThe forecast that got the direction right and the resilience wrong — useful context for any claim about digital permanence.
- Digital PreservationWhat it actually takes to keep a structured record readable across decades, and why paper set a bar that is hard to match.
- History of ScanningThe capability that turned paper archives into files — and the reason a file is not yet a record.
Continue in the archive
Related reading
History · The page on the desk
The History of Desktop Publishing
How the production of a finished page collapsed from a multi-trade workflow into a single desk — and what that displaced.
History · The managed-document enterprise
Enterprise Document Management
How organisations moved from filing cabinets to managing documents as governed records: captured, indexed, retrieved, retained, and disposed of by rule.
Guides · Advanced
Optical character recognition (OCR)
Editorial reference on OCR: its history, recognition pipeline, techniques, accuracy factors, and role in scanning and document workflows.
Tools
What Is a PDF?
An explanation of the PDF format and why it is central to printing and document workflows.