Definition and terminology
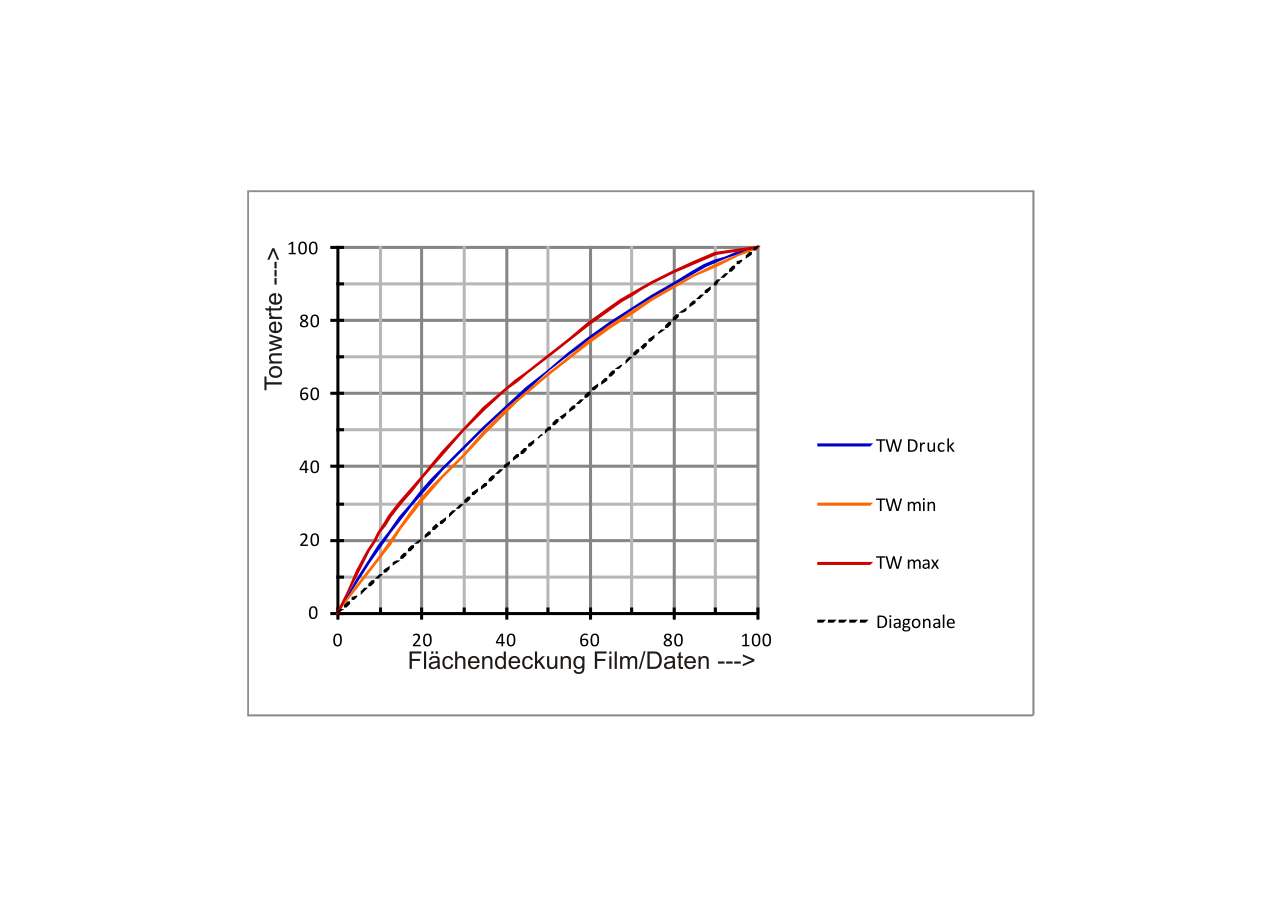
Dot gain is the increase in the apparent area of a halftone dot as an image moves from its digital or film original, through platemaking, to the final printed sheet. Because a halftone renders tone as the fraction of area covered with ink, any enlargement of the dots raises the covered fraction and darkens the reproduced tone. Dot gain is therefore expressed as a difference in tonal value rather than as a physical dimension: for example, if a region specified as a 40% tint prints as roughly a 60% tint, the gain at that step is about 20 percentage points.
In current standards terminology the effect is called tone value increase (TVI); the variant "tonal value increase" is also seen. The terms describe the same phenomenon, and "tone value increase" is preferred in documents such as ISO 12647 because the effect is quantified as an increase in tone value (percentage dot area) rather than as a change in any single dot's measured width. "Dot gain" remains in widespread historical and informal use.
Gain is always tied to a reference tone. Because the amount of gain varies across the tonal range, a single figure such as "X% dot gain" is meaningful only when the tone it was measured at is stated — conventionally a midtone step. The full curve of gain across the range is more informative than any single number.
- Intended (input) tone value: the dot area requested by the file, film, or plate.
- Printed (output) tone value: the dot area actually measured on the sheet.
- Dot gain / TVI: printed value minus intended value, quoted at a stated reference tone.
Mechanical (physical) dot gain
Mechanical dot gain, also called physical dot gain, is a genuine enlargement of the inked area: the ink or toner forming a dot ends up covering more of the substrate than the corresponding dot on the plate, film, or in the file. Several stages can contribute, and their relative weight depends on the printing process.
- Imaging and platemaking: exposure, development, and — in film-based workflows — contact-copying steps can enlarge or shrink dots before any ink is applied. Computer-to-plate (CtP) imaging removes the film generations that historically added gain, but plate exposure and processing still influence dot size.
- Ink film and impression: on an offset press the ink film has thickness, and the impression squeezes it against the blanket and paper, so the dot spreads laterally under pressure. Heavier ink films and higher impression pressure increase the spread.
- Substrate absorbency: on uncoated and porous stocks, liquid ink wicks into the paper fibers and spreads outward from the dot; coated papers hold ink nearer the surface and spread less.
Related press disturbances such as slurring and doubling can smear or duplicate the printed dot as well. Because mechanical gain is a real change in covered area, it could in principle be observed by measuring the physical dot under magnification; in practice it is usually inferred from optical measurements combined with a model of how light behaves in the paper.
Optical dot gain and the Yule–Nielsen effect
Optical dot gain is an apparent darkening rather than a physical one: the inked area does not grow, yet the dot reads as larger and darker because of how light interacts with the paper. Light entering the substrate near a dot scatters laterally beneath the surface; some travels under the edge of the dot and is absorbed by the ink from below, or is absorbed at the margins on the way in and out. In effect each dot casts a shadow into the surrounding paper, so a densitometer — and the eye — perceives more coverage than the ink physically occupies.
This light-penetration behavior is commonly called the Yule–Nielsen effect, after J. A. C. Yule and W. J. Nielsen, who described the penetration of light into paper and its effect on halftone reproduction. Its magnitude depends on the paper's optical properties — chiefly how strongly it scatters light — and it interacts with screen fineness: finer screens present more total dot edge per unit area for light to leak across, which is one reason very-small-dot stochastic (FM) screens are especially sensitive to gain.
Because the dot's physical size is unchanged and only its effective absorbance rises, some references treat optical gain as distinct from "true" (mechanical) dot gain, even though a reflection densitometer records the two together. Since optical gain is a property of light and paper rather than of ink coverage, it cannot be removed by simply printing "lighter"; it is instead accounted for in measurement and in the compensation applied upstream.

Measuring dot gain
Dot gain is quantified by measuring the tonal value actually achieved and subtracting the intended value. The tonal value of a printed tint is most often derived from reflection densitometry using the Murray–Davies equation, which estimates the effective (apparent) dot area from the measured densities of the tint and the solid:
a = (1 − 10^(−Dt)) / (1 − 10^(−Ds))
Here a is the fractional dot area, Dt is the density of the halftone tint patch, and Ds is the density of the solid, both measured relative to the unprinted paper. A reading interpreted this way reports the total apparent dot area — it includes both the mechanical and the optical components, because the instrument sees the same shadowed dots the eye does.
To separate the physical (mechanical) dot area from the optical contribution, the Yule–Nielsen modification introduces an empirical exponent n, the "n-factor", into the same relationship:
a = (1 − 10^(−Dt/n)) / (1 − 10^(−Ds/n))
With n = 1 the expression reduces to Murray–Davies and yields the total apparent area; a larger n compensates for light scatter and better approximates the physical dot area, so the difference between the two estimates indicates the size of the optical component. The n-factor is empirical and depends on paper and screen, so it is measured or chosen for the conditions at hand rather than fixed universally.
Measurements are taken from standardized tint scales (step wedges) carried in a control strip printed with the job, and can be made at several stages — on film, on the plate, and on the printed sheet — to attribute gain to specific steps. Spectrophotometers and modern measurement systems perform the equivalent computation and can additionally evaluate color, not only neutral density.
The dot-gain curve: why midtones darken most
Dot gain is not uniform across the tonal range. Both the mechanical and optical mechanisms act mainly at the boundary between inked and bare paper, so the amount of gain tracks the total length of dot edge present in a tint. That edge length is smallest near the extremes — a near-white highlight holds only a few tiny dots, and a near-solid shadow leaves only small gaps between merged dots — and largest through the middle of the range, where dots and the gaps between them are comparable in size, before falling again as dots begin to touch and their available perimeter is reduced.
Plotting gain against input tone therefore typically produces a curve that is near zero at 0% and 100% and rises to a maximum in the midtones, commonly cited around the 40–60% region. The exact location and height of the peak depend on the process, ink, screen ruling, and substrate, so the midtone maximum is a general tendency rather than a fixed rule. This midtone weighting is why dot gain is often first noticed as photographs "plugging up" or looking muddy through their middle tones, while extreme highlights and solids appear comparatively unaffected.
Dependence on substrate, screen, and process
The magnitude of dot gain is not a property of an image on its own; it is a property of the whole printing condition — the particular combination of process, ink, screen, and substrate.
- Substrate: absorbent, rough, uncoated stocks such as newsprint generally produce more mechanical spread, and often more optical scatter, than smooth coated papers, so the same file prints darker in the midtones on uncoated stock. This is a primary reason that usable screen ruling (LPI) and the aim values in printing standards are tied to paper type.
- Screen ruling and type: for a given process, finer rulings pack more dot edge into each unit of area and therefore tend to gain more; frequency-modulated (stochastic) screening, built from very small dots, is more edge-heavy still and calls for correspondingly careful characterization.
- Process: offset lithography, gravure, flexography, screen printing, electrophotographic (toner) output, and inkjet each show characteristic gain behavior arising from how they form and transfer dots. Processes with thick ink films or soft, compressible plates generally exhibit more spread. Each is characterized on its own terms.
Because gain depends on the full condition, a value measured for one paper-and-press combination should not be assumed to hold for another.
Compensation, calibration, and standards
Dot gain is expected and repeatable, so the goal is to manage it rather than eliminate it. The general method is to characterize the printing condition by measurement and then apply an inverse correction upstream, so that the intended tones are what finally appear on the sheet.
- Characterize: a test form of known tint steps is printed under production conditions and measured to obtain the actual TVI curve.
- Compensate: an inverse compensation (or transfer) curve is computed that reduces the requested dot values by the amount the process will add, so that a tone intended as 50% is imaged smaller and gains back to 50% on the sheet.
- Apply: this curve is typically applied in the raster image processor (RIP) or in the plate-imaging (CtP) calibration, so that screening and compensation occur together at output time. It can also live in device calibration and be captured within ICC output profiles, whose characterization data reflect the press's real tone reproduction.
Printing standards define target behavior so that different sites can match one another. ISO 12647 specifies aim tone value increase values, with tolerances that depend on paper type and screening, giving presses a common target to calibrate toward. Some related industry approaches — for example gray-balance-based process-control methodologies — pursue consistent appearance through neutral tone reproduction rather than by matching a TVI curve directly. In every case the objective is agreement between proof and press and repeatability from run to run, which is possible only once gain has been measured and compensated.
Relationship to halftoning and adjacent concepts
Dot gain is a direct consequence of halftone reproduction and is best read alongside the broader halftoning overview, which introduces amplitude- and frequency-modulated screening, screen ruling (LPI), and where screening sits in the print pipeline. This page concentrates specifically on how and why halftone dots enlarge, and how that enlargement is measured and corrected; the mechanics of generating the dot pattern itself are covered there.
Several adjacent ideas connect closely:
- Per-ink behavior: in process-color printing each separation is screened and gains independently, so dot gain is characterized for cyan, magenta, yellow, and black rather than assumed equal. Uneven gain between inks shifts hue and gray balance, not merely lightness, which ties dot gain to CMYK reproduction and to color management generally.
- Screening sensitivity: because stochastic (FM) screens and high-ruling AM screens carry more dot edge, they amplify gain and demand tighter control — a tradeoff weighed when choosing a screen.
- Ink limits: since gain darkens and spreads ink, heavy shadow and overprint regions interact with total-area-coverage (ink-limit) decisions made during separation and profiling.
- Proofing and profiling: a proof is trustworthy only if it reproduces the press's gain, so dot-gain characterization underlies printer profiling, soft proofing, and the construction of output ICC profiles.
Dot gain should not be confused with deliberate tonal edits (such as curves applied for creative contrast) or with trapping and misregistration, which concern the relationship between separations rather than the size of individual dots.
Frequently asked questions
- What is the difference between dot gain and tone value increase (TVI)?
- They name the same effect. "Tone value increase" is the term used in current standards such as ISO 12647 because the effect is measured as an increase in tone value (percentage dot area); "dot gain" is the older and still common informal name. Both refer to printed dots reproducing a larger, darker tone than intended.
- What causes dot gain?
- Two mechanisms combine. Mechanical (physical) gain is real spreading of ink on and into the substrate under ink-film thickness, press pressure, and paper absorbency. Optical gain is an apparent darkening caused by light scattering within the paper beneath the dot edges (the Yule–Nielsen effect), which makes dots read as larger than the ink they contain. A reflection densitometer measures the two together as total apparent gain.
- Why is dot gain worst in the midtones?
- Both mechanisms act mainly at the edges of dots, and the total length of dot edge in a tint is greatest in the midtones, where dots and the gaps between them are similar in size. Edge length falls toward zero at the highlight and shadow extremes, so the gain curve typically peaks somewhere in the midtones — commonly cited around the 40–60% region — and approaches zero at 0% and 100%.
- How is dot gain measured?
- A known tint scale is printed under production conditions and measured, usually by reflection densitometry. The Murray–Davies equation converts tint and solid densities into an apparent dot area, and the printed value minus the intended value at a stated tone gives the gain. The Yule–Nielsen modification adds an empirical n-factor to separate the physical dot area from the optical component. Gain is normally reported for a midtone reference and, more fully, as a curve across the range.
- How is dot gain corrected?
- It is compensated, not removed. The printing condition is characterized by measuring its TVI curve, and an inverse compensation (transfer) curve is applied — typically in the RIP or plate calibration — so that requested tones are imaged smaller and gain back to the intended value on the sheet. Standards such as ISO 12647 provide aim values to calibrate toward, and the behavior is also captured in ICC output profiles used for proofing and profiling.
Source transparency (3 sources)
These references support claims made in this entry. The archive uses verified institutional and public-domain sources only; see Source policy.
Sources consulted (3)
Continue in the archive
Related reading
Tools
Amplitude Modulation (AM) Screening
Amplitude modulation (AM) screening: how conventional halftone screens vary dot size on a fixed grid, plus screen ruling, angles, moire, and rosette patterns.
Guides · Advanced
Printer Profiling
How printer profiling characterizes a printer, ink, and paper combination to build an ICC output profile for predictable, color-managed printing.
Tools
Halftoning
Halftoning simulates continuous-tone images using patterns of dots on bi-level printing devices. History, AM vs FM screening, PostScript and PDF halftones.
Tools
Halftone Screen Angles
Halftone screen angles rotate each CMYK separation to prevent moire: the conventional 30-degree separation, yellow's 15-degree case, and supercell screening.